Gabor Granger (GG) method is a pricing analysis technique to optimize pricing decisions under certain market conditions. It helps to understand the elasticity of demand – change in demand with respect to changes in prices. The elasticity of demand will determine if the price can be increased or decreased without affecting the demand, thus increasing the profit margin. GG analysis will provide three important metrics – the demand for the product at various price points, maximum revenue generating price point and price elasticity.
When it can be Used?
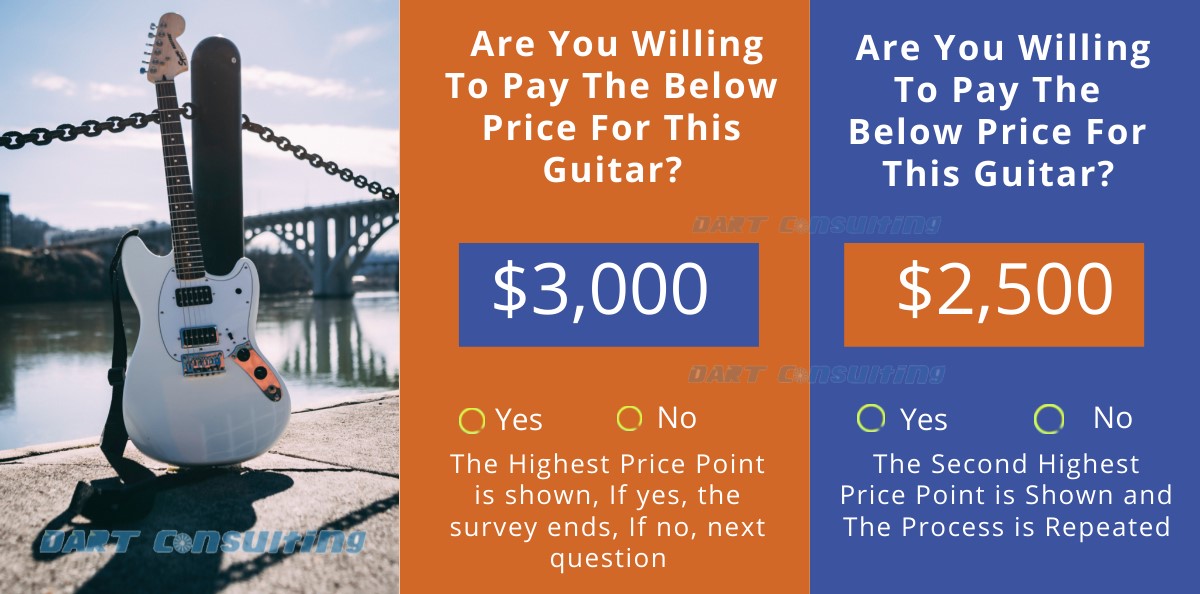
The GG method is most preferred for an existing product that needs price optimization due to improved features, discount price, competitions, outdated technology, etc. Therefore, businesses need to have predefined set of price choices to discuss with the potential customers or survey respondents. They should also finalize the maximum price point that needs to be asked of the survey respondents.
How is it Used?
The Gabor Granger method works on simple procedure by asking the respondent on what the maximum price they are willing to pay for the products shown using predefined set of price points. The price points will be shown in random sequence or from the highest price. The question will be repeated with different price points until the maximum price a respondent is willing to pay is determined.
What is Analyzed?
The outcome of the survey must provide the number of customers willing to pay the maximum price for each price point. Thus, using the survey data, the demand (number of customers), revenue based on the price vs demand and price elasticity can be calculated as shown below.
| Price | Count | Demand | Cumulative Percentage | Revenue | Price Elasticity |
| 1,000 | 14 | 54 | 98% | 54,000 | |
| 1,500 | 11 | 40 | 73% | 60,000 | 0.5 |
| 2,000 | 9 | 29 | 53% | 58,000 | 0.8 |
| 2,500 | 12 | 20 | 36% | 50,000 | 1.2 |
| 3,000 | 8 | 8 | 15% | 24,000 | 3.0 |
| 55 |
The GG method will quickly provide insight into the optimal price point that can generate maximum revenue for the business. In this case, $1,500 will generate maximum revenue of $60,000. Further to analyze how far the price change will impact on the demand, it is important to understand the elasticity of demand. This elasticity analysis is crucial to finalize the price as to whether to increase or decrease beyond a price level.
Price Elasticity
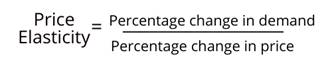
Price Elasticity itself is calculated for two different uses as elasticity of demand and elasticity of supply. The latter is used to understand the supply side and not applicable for customer surveys. Hence, we focus on price elasticity of demand side for this article. It can be defined as the rate of change in demand / consumption in relation to the rate of change in price. In simple mathematical expression, it is shown as
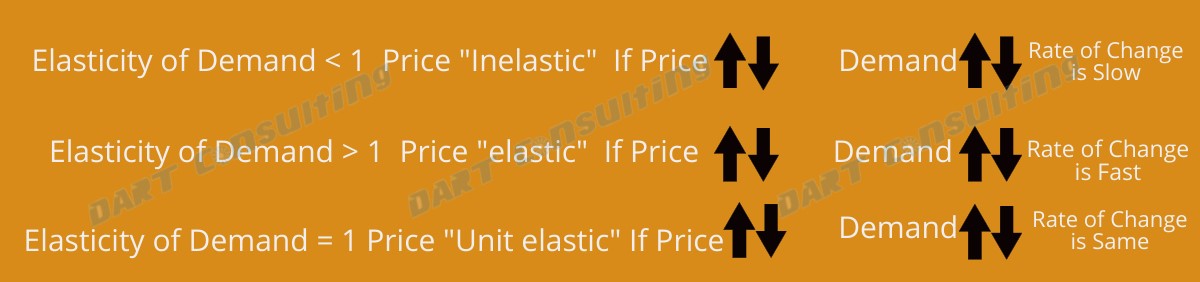
This price elasticity has three key conditions that will help us to show the impact of price change vs demand.
Price Inelastic: If the elasticity of demand is less than “1”, then it is considered “inelastic”. That means, even if the price is increased after the revenue maximizing price point, the decrease in demand is less as compared to the increase in price. Therefore, businesses have further opportunity to increase the price beyond the revenue maximizing price point. In our case, $1,500 is generating maximum revenue, but the company can test by increasing its price up to $2,000 as the demand will not decrease faster than the price increase.
Price Elastic: This occurs when the elasticity of demand is greater than “1”. This indicates that increasing the price further will affect the decrease in demand and reduce the revenue drastically. If the product shown is priced at $2,000 and increases thereafter, it will decrease the demand faster than the rate of price increase. Thus, the price increase cannot outweigh the demand resulting in poor revenue.
Unit elasticity: Elasticity of demand will be equal to 1 in the unit elasticity. The percentage change in price increase will be proportional to the percentage change in demand decrease. From this price point to the next elasticity change, the revenue will remain the same with an increase or decrease in price as the demand will also increase or decrease to the same proportion. This price point will be helpful if the company decides to at least achieve the previous revenue mark even after price change. This is a safer zone where the business does not like to lose the previously achieved profit. For e.g. If the company sells the guitar at a price of $1,000 and the number of sales per month is 12, then the revenue generated will be $12,000. The company decided to reduce the price by 20% ($800) so it can increase the demand and make more revenue. But the company also would like to find the unit elasticity ratio in order to at least achieve its previous revenue to be safer. If the sale increases by 25%, then the company could achieve the same revenue as $12,000. This is called unit elasticity.
The price elasticity can be illustrated as below.
The price elasticity is an important metric even if the revenue maximizing price point is known. The price elasticity will tell the business till where the price point can be increased or decreased because the survey itself cannot ask every price point from the customers which will make the respondent lose their focus.
DART Consulting provides business consulting through its network of Independent Consultants. Our services include preparing business plans, market research, and providing business advisory services. More details at https://www.dartconsulting.co.in/dart-consultants.html